Terraform Visualization

Hi there, I'm a prior hybrid network engineer transformed cloud engineer, and I enjoy writing posts about my technical journey including implementation guides, insights, tips, scripts and graphics from what I've gleaned along the way.
You can visualize 🔎 the components used to build your terraform plan executions with 𝘁𝗲𝗿𝗿𝗮𝗳𝗼𝗿𝗺 𝘃𝗶𝘀𝘂𝗮𝗹 available at: https://hieven.github.io/terraform-visual/
The config in this gif is from a lab I'm working on deploying AWS IAM objects which include local custom modules, meta-arguments, variable types and expressions:
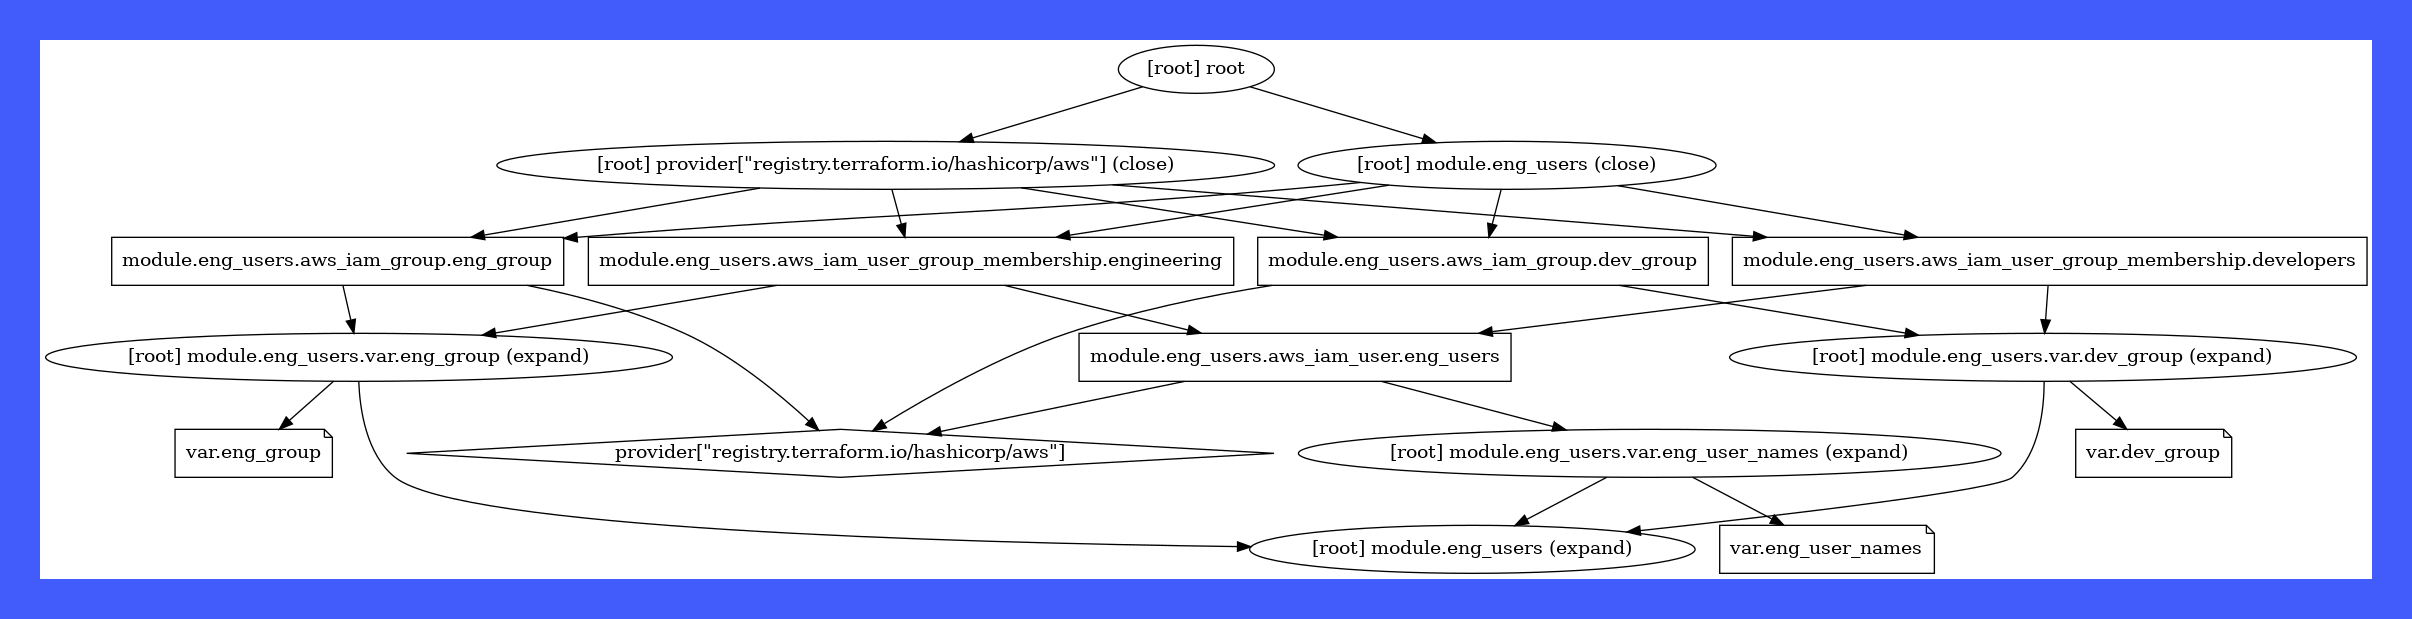
I only recently started looking into terraform visualization tools and have experimented with this one and 𝘁𝗲𝗿𝗿𝗮𝗳𝗼𝗿𝗺 𝗴𝗿𝗮𝗽𝗵 so far. Terraform graph adds a bit of granularity to the visualization as it includes all components such as variables, providers, etc. However, it can be a bit more difficult to follow the code logic at first glance depending on complexity. Here's the png output from my AWS IAM lab using terraform graph:
If you're on Ubuntu/Debian 🖥 check it out by running the following:
sudo apt-get update
sudo apt install graphviz
terraform graph -type=plan | dot -Tpng -o graph.png
Both of these tools 🔧 offer a helpful way to better understand your Terraform infra code particularly if the config is complex, there's little to no documentation on the code logic, or you're newer to Terraform in general. I also like how easy they are to spin up and use plus they're open-source 😎 That said, always be cautious about uploading config files containing private/secure data to a remote website like terraform visual. In those scenarios, it'd be best to run something locally like terraform graph.
Are there other tools you've found useful for visualizing terraform infra?